26.3% Drop in Locks Heath People Moving Home in the Last 10 Years

I was having a lazy Saturday morning recently reading through the newspapers.   I find the most interesting bits are their commentaries on the British Housing Market.  Some talk about property prices, whilst others discuss the younger generation grappling to get a foot-hold on the property ladder with difficulties of saving up for the deposit.  Others feature articles about the severe lack of new homes being built.  A group of people that don’t often get any column inches however are those existing homeowners who can’t move!

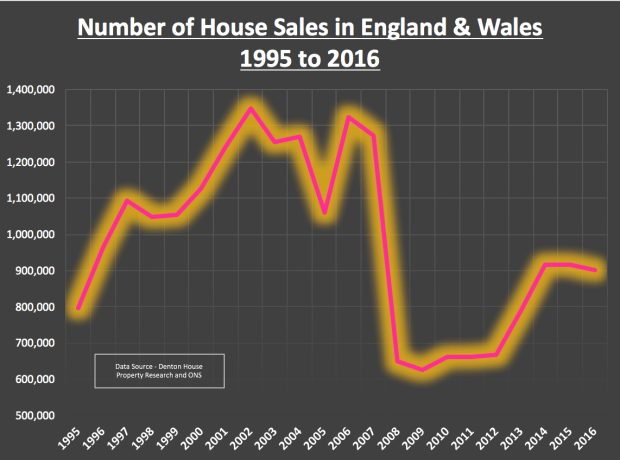
Back in the early 2000’s, between 1m and 1.3m people moved each year in England and Wales, peaking at 1,349,306 home-moves (i.e. house sales) in 2002.  However, the ‘credit crunch’ hit in 2008 and the number of house sales fell to 624,994 in 2009.  Since then this has steadily recovered, albeit to a more ‘respectable’ 899,708 properties by 2016.  This means there are around 450,000 fewer house sales (house moves) each year compared to the Noughties.  The question is … why are there fewer house sales?

185 Eng and Wales Moving Graph FIXED

To answer that, we need to go back 50 years.  Inflation was high in the late 1960’s, 70’s and early 80’s.  To combat this, the Government raised interest rates to a high level in a bid to lower inflation.  Higher interest rates meant the householders monthly mortgage payments were higher, meaning mortgages took a large proportion of the homeowner’s household budget. However, this wasn’t all bad news since inflation tends to erode mortgage debt in ‘real spending power terms’.  Consequently, as wages grew (to keep up with inflation), this allowed home owners to get even bigger mortgages.  At the same time their mortgage debt was decreasing, therefore allowing them to move up the property ladder quicker.

Roll the clock on to the late 1990’s and the early Noughties, and things had changed.  UK interest rates tumbled as UK inflation dropped.  Lower interest rates and low inflation, especially in the five years 2000 to 2005, meant we saw double digit growth in the value of UK property.  This inevitably meant all the home owner’s equity grew significantly, meaning people could continue to move up the property ladder (even without the effects of inflation).

This snowball effect of significant numbers moving house continued into the mid Noughties (2004 to 2007), as Banks and Building Society’s slackened their lending criteria.  [You will probably remember the 125% loan to value Northern Rock Mortgages that could be obtained with just a note from your Mum!!].  This meant home movers could borrow even more to move up the property ladder.

So, now it’s 2017 and things have changed yet again!

You would think that with ultra-low interest rates at 0.25% (a 320-year low) the number of people moving would be booming – wouldn’t you?  However, this has not been the case.  Less people are moving because:

(1) low wage growth of 1.1% per annum

(2) the tougher mortgage rules since 2014

(3) sporadic property price growth in the last few years

(4) high property values comparative to salaries

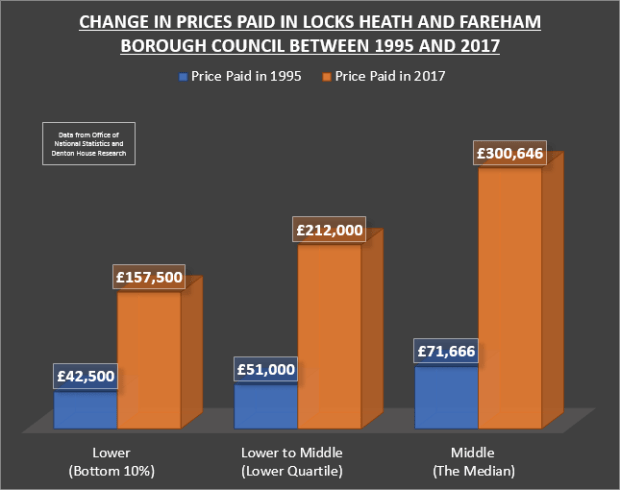
What does this translate to in pure numbers locally?

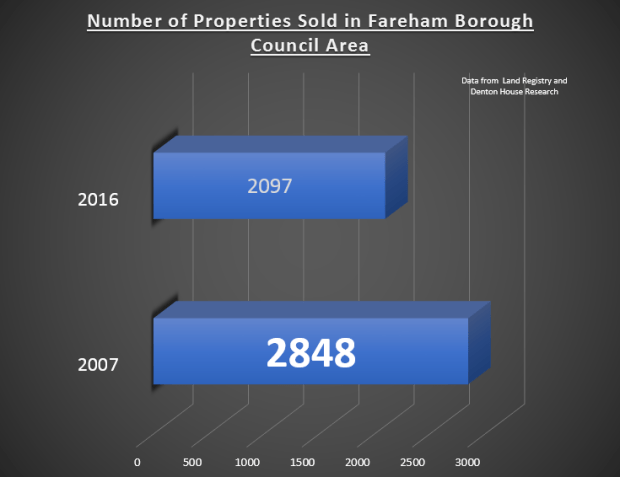
In 2007, 2,848 properties sold in the Fareham Borough Council area and last year, in 2016 only 2,097 properties sold – a drop of 26.37%.

185 Graph

Therefore, we have just over 750 less households moving in the Locks Heath and surrounding Council area each year.  Now of that number, it is recognised throughout the property industry around fourth fifths of them are homeowners with a mortgage. That means there are around 616 mortgaged households a year (fourth fifths of the figure of 750) in the Locks Heath and surrounding council area that would have moved 10 years ago, but won’t this year.

The reason they can’t/won’t move can be split down into different categories, explained in a recent report by the Council of Mortgage Lenders (CML). So, of those estimated 616 annual Locks Heath (and surrounding area) non-movers, based on that CML report –

  1. There are around 222 households a year that aren’t moving due to a fall in the number of mortgaged owner occupiers (e. demographics).


  1. I then estimate another 86 households a year are of the older generation mortgaged owner occupiers. As they are increasingly getting older, older people don’t tend to move, regardless of what is happening to the property market (e. lifestyle).


  1. Then, I estimate 37 households of our Locks Heath (and surrounding area) annual non-movers will mirror the rising number of high equity owner occupiers, who previously would have moved with a mortgage but now move as cash buyers (e. high house price growth).


  1. I believe there are 271 Locks Heath (and surrounding area) mortgaged homeowners that are unable to move because of the financing of the new mortgage or keeping within the new rules of mortgage affordability that came into play in 2014 (e. mortgage).


The first three above are beyond the Government or Bank of England control.  However could there be some influence exerted to help the non-movers because of financing the new mortgage and keeping within the new rules of mortgage affordability? If Locks Heath property values were lower, this would decrease the size of each step up the property ladder.  This would mean the opportunity cost of increasing their mortgage would reduce (i.e. opportunity cost = the step up in their mortgage payments between their existing and future new mortgage) and they would be able to move to more upmarket properties.

Then there are the mortgage rules, but before we all start demanding a relaxation in lending criteria for the banks, do we want to return to free and easy mortgages – 125% Northern Rock footloose and fancy-free mortgage lending that seemed to be available in the mid 2000’s… available at a drop of hat and three tokens from a cereal packet?

We all know what happened with Northern Rock.

Slowing Locks Heath Property Market? Yes and No!

Yes and NoMy thoughts to the Landlords and homeowners of Locks Heath…

The tightrope of being a Locks Heath buy-to-let Landlord is a balancing act many do well at. Talking to several Locks Heath Landlords, they are very conscious of their Tenants’ capacity and ability to pay the rent and their own need to raise rents on their rental properties (as Government figure shows ‘real pay’ has dropped 1% in the last six months).  Evidence does suggest many Landlords feel more assured than they were in the spring about pursuing higher rents on their properties.

During the summer months, historic evidence suggests that the rents new Tenants have had to pay on move in have increased.  June/July/August is a time when renters like to move, demand surges and the normal supply and demand seesaw mean Tenants are normally prepared to pay more to secure the property they want to live in, in the place they want to be.  This is particularly good news for Locks Heath Landlords as average Locks Heath rents have been on a downward trend recently.  So look at the figures here…

183 Graph

Rents in Locks Heath on average for new tenants moving in have risen 0.9% for the month, taking overall annual Locks Heath rents 0.9% lower for the year

However, several Locks Heath Landlords have expressed their apprehensions about a slowing of the housing market in Locks Heath.  I think this negativity may be exaggerated.

Before we get the Champagne out, the other side of the coin to property investing is capital values (which will also be of interest to all the homeowners in Locks Heath as well as the Locks Heath buy-to-let Landlords).  I believe the Locks Heath property market has been trying to find some level of equilibrium since the New Year.  According to the Land Registry…

Property Values in Locks Heath are 6.25% higher than they were 12 months ago, rising by 0.01% last month

Yet, I would take those figures with a pinch of salt as they reflect the sales of Locks Heath properties that took place in early Spring 2017 and now are only exchanging and completing during the summer months.

The reality is the number of properties that are on the market in Locks Heath today has risen by 32.5% since the New Year and that will have a dampening effect on property values.  As Tenants have had less choice, buyers now have more choice… and that will temper Locks Heath property prices as we head towards 2018.

Be you a homeowner or Landlord, if you are planning to sell your Locks Heath property in the short term, it is crucial, especially with the rise in the number of properties on the market, that you realistically price your property when you bring it to the market… with the increase in choice of properties, the balance of power during negotiation generally sways towards the buyer.  Given that everyone now has access to property details, including historic stats for how much property have sold for, they will be more astute during the offer and negotiation stages of a purchase.

However, even with this uplift in the number of properties for sale in Locks Heath, property prices will remain stable and strong in the medium to long term.  This is because the number of properties on the market today is still way below the peak of summer of 2008, when there were 871 properties for sale compared to the current level of 411 (if you recall, prices dropped by nearly 20% in Credit Crunch years of ‘08 and ‘09).

Compared to 2008, today’s lower supply of Locks Heath properties for sale will keep prices relatively high… and they will continue to stay at these levels for the medium to long term.

Less people are moving than a few years ago, meaning less property is for sale.  Fewer properties for sale mean property prices remain relatively high and this is because of a number of underlying reasons.  Firstly, buy-to-let Landlords tend not sell their properties as often than owner-occupiers, consequently removing the property out of the housing market selling cycle.  Secondly, Stamp Duty is much higher compared to 10 years ago (meaning it costs more to move).  Next, there is a dearth of local authority rental housing so demand for private rented housing will remain high.  Then we have the UK’s maturing owner occupier population, meaning these older people are less likely to move (compared to when they were younger).  Another reason is the lack of new homes being built in the country (we need 240k houses a year to be built in the UK and we are currently only building 145k a year!) and finally, the new mortgage rules introduced in 2014 about how much a person can borrow on a mortgage has curtailed demand.

Some final thought’s before I go – to all the Locks Heath homeowners that aren’t planning to sell – this talk of price changes is only on paper profit or loss.  To those that are moving… most people that sell, are buyers as well, so as you might not get as much for yours, the one you will want to buy won’t be as much, (swings and roundabouts as Mum used to say!).

To all the Locks Heath Landlords – keep your eyes peeled – I have a feeling there may be some decent buy-to-let deals to be had in the coming months.  One place for such deals, irrespective of which agent is selling it, is my Locks Heath Property Blog.

Locks Heath’s New 3 Speed Property Market

3 speed
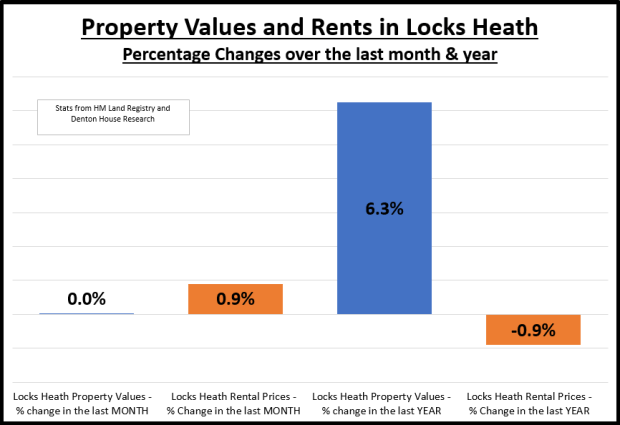
“What’s happening to the Locks Heath Property Market?” is a question I am asked repeatedly.  Well, would it be a surprise to hear that my own research suggests that there isn’t just one big Locks Heath property market – but many small micro-property markets?

According to recent data released by the Office of National Statistics (ONS), I have discovered that at least three of these micro-property markets have emerged over the last 20+ years in the suburb.

For ease, I have named them the …

  1. lower’ Locks Heath Property Market.
  2. lower to middle’ Locks Heath Property Market.
  3. ‘middle’ Locks Heath Property Market.

The ‘lower’ and ‘lower to middle’ sectors of the Locks Heath property market have been fuelled over the last few years by two sets of buyers.  The first set, making up the clear majority of those buyers, are cash rich landlord investors who are throwing themselves into the Locks Heath property market to take advantage of alluringly low prices and even lower interest rates.  The other set of buyers in the ‘lower’ and ‘lower to middle’ Locks Heath property market are the first-time buyers (FTB), although the FTB market is in a state of unparalleled deadlock as it’s been trampled into near-immobility and incapacity by the new 2014 stricter mortgage affordability regulations and also fewer mortgages with low deposits.

Some of you may be interested to know how I have classified the three sectors ..

  1. lower’ Locks Heath housing market – the bottom 10% (in terms of value) of properties sold
  2. lower to middle’ Locks Heath housing market – lower Quartile (or lowest 25% in terms of value) of properties sold
  3. middle’ Locks Heath housing market – which is the median in terms of value

…. and if one looks at the figures for Fareham Borough Council area you can see the three different sectors (lower, lower/middle and middle) have performed quite differently.

Fareham Borough Council Property Market – Sold Prices Price Paid in 1995 Price Paid in 2017 Percentage Uplift

1995 – 2017

Lower (Bottom 10%) £42,500 £157,500 270.59%
Lower to Middle (Lower Quartile) £51,000 £212,000 315.69%
Middle (The Median) £71,666 £300,646 319.51%

181 Graph

You can quite clearly see that it is the ‘middle’ market that has performed the best.

You might ask, what do all these different figures mean to homeowners and landlords alike?  Quite a lot – so let me explain.  The worst performing sector (with the lowest Percentage uplift) was the ‘lower’ housing market.  Therefore, interestingly, if we applied the best percentage uplift figure (i.e. from the ‘middle’ market percentage uplift), to the ‘lower’ 1995 housing market figure, the 2017 figure of £157,500, would have been £178,292 instead – quite a difference you must agree?

Now, I have specifically not mentioned the upper reaches of the Locks Heath housing market for several reasons.  Firstly, the lower or middle market is where most of the buy to let investment landlords buy their property and where the majority of property transactions take place.  Secondly, due to the unique and distinctive nature of Locks Heath’s up-market property scene (because every property is different and they don’t tend to sell as often as the lower to middle market), it is much more difficult to calculate what changes have occurred to property prices in that part of the Locks Heath property market – looking at the stats for the up-market Locks Heath property market from Land Registry, only 17 properties in Locks Heath (and a 5 mile radius around it) have sold for £2,000,000 or more since 1997.

So, what should every homeowner and buy to let landlord take from the information that there are many micro-property markets?  Well, when you realise there isn’t just one Locks Heath Property Market, but many Locks Heath “micro-property markets”, you can spot trends and bag yourself some potential bargains.  Even in this market, I have spotted a number of bargains over the last few months that I have shared in my Property Blog and to my landlord database, especially in the ‘lower’ and ‘lower/middle’ market.  If you want to be kept informed of those buy to let bargains, have a look at my blog www.thelocksheathpropertyblog.co.uk.  It is free to do so and I’m sure you wouldn’t want to miss out – would you?

I would love to know if you have spotted any micro-property markets in Locks Heath.